
Excel Tutorials and Resources
Here at the Quantitative Resources Center, we have compiled a list of Excel tutorials students have found helpful in the past. We have categorized them by topic to make it
easier for students to find the help they need.
Excel Basics
Below are some fast and easy tutorials for understanding the basics of Microsoft Excel.
They cover topics ranging from how to create and manage spreadsheets, to creating graphs
and charts, and more!
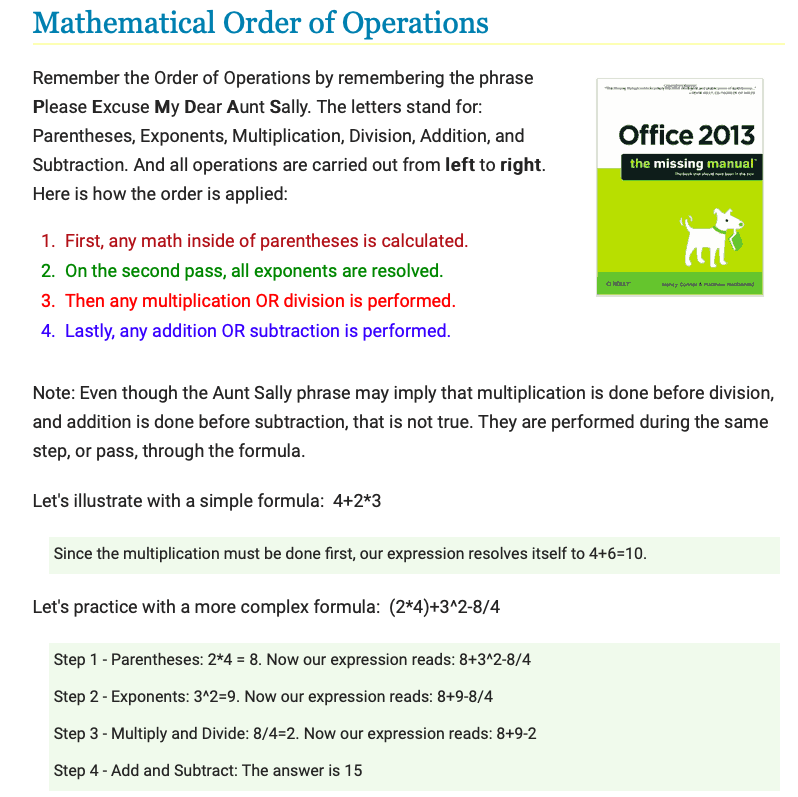
Here are some helpful tips for doing basic math in Excel.

GFC Global Education Network — https://edu.gcfglobal.org/en/excel2016/
Graphing and Charts
Below are some resources aimed at helping students create a wide variety of different charts and graphs. It’s important to be able to make and understand many different visual representations for the data you’ll be working within Excel. These resources help students decide for themselves which kind of representation they need for their specific dataset as well as how to create an effective graph.
North Carolina State University Graphing Guide — https://tinyurl.com/yc8w4uml
Creating Advanced Charts — https://tinyurl.com/yaksw6zf
“How to Make a Graph in Excel and Add Visuals to Your Reporting” — https://tinyurl.com/y76hl7mh
Excel Statistics
Many of our students use Excel for their statistics courses. Here are some useful tools to help manage, manipulate, and analyze statistical data.
Basic Statistical Tools in Excel — https://tinyurl.com/y89264hj
University of Texas Statistics Help Guide for Excel — https://tinyurl.com/yd5h2gue
A guide for importing data and making data models — https://tinyurl.com/y7s4vnt7
PHSTAT
PHSTAT is an Excel extension used for more complex statistical analyses. It is required in a number of courses at SPS. We have gathered a list of effective websites and tutorials fur learning how to work within PHSTAT.
Chief among these resources is a series of YouTube tutorials by Dawn Wright, Ph.D., called “The Stats Files.” She has posted dozens of videos explains virtually every possible function PHSTAT has to offer students.
https://www.youtube.com/channel/UCN9jJ__WlmK920O-wt-QMyA/featured
Dr. Wright has also made a PDF tutorial for students — https://tinyurl.com/ydcvjfhm
Business and Finance on Excel
Excel is an extremely useful application for managing finances and business information. It is often used in SPS courses for practice in areas ranging from complex topics like accounting and finance to simple budgeting.
Microsoft Excel as a Financial Calculator — https://tinyurl.com/y77bdvxe
Guide to Excel For Finance — https://tinyurl.com/y7q2fprr
Top 15 Financial Functions in Excel — https://tinyurl.com/y9wgecmo
Miscellaneous Tools and Tutorials
Lynda.com
Lynda is a comprehensive website offering dozens of different tutorials in specific mathematical and Excel concepts. It is free and open for anyone with a New York Public Library card.
40 Best Excel Tutorials — https://tinyurl.com/ya38z8uk
Access Tutorials and Resources
Microsoft Access is a software designed for business and data analytics. Below are some
resources for helping students get a head start using the program.
Quackit Microsoft Access Tutorial — https://tinyurl.com/y9ey5nel
Interactive Tutorial and Support from Microsoft — https://tinyurl.com/y49943jh
Tableau Tutorials and Resources
Tableau is a statistical software aimed specifically at managing and analyzing business
data. We have prepared some tutorials on how to use the program below.
https://www.youtube.com/watch?v=GkJwcyI_1vc
Tableau Official Tutorial — https://tinyurl.com/yahz6ghd
Tutorial Gateway: A Step by Step Guide to Tableau — https://tinyurl.com/ycamvgx8

This entry is licensed under a Creative Commons Attribution-NonCommercial-ShareAlike 4.0 International license.